Key Performance Indicators (KPIs) are a powerful tool that can be leveraged to identify the status of outcomes in the organization and its business goals. KPIs are composite calculations that be used to show the status of metric outcomes using up to 3 core metric values and banding:
- actual - a value that shows what is currently measured
- target - a value that measures what the goal metric should be
- status - a mathematical comparison between actual and target values (normally a ratio of some type)
- banding - a series of values to delineate between good and bad status metrics (which can then be used graphically)
Using all metric layers, users can construct graphic representations of how the core metric (typically the "actual" value) is performing in contrast to the other figures (typically "target").
More advanced KPIs are usually built in the Formulate KPI toolset, with greater control over defining actual, target, status and banding values. However, the Quick KPI wizard allows users to build classic foundational KPIs through a single click directly in Discover. Regardless of which tool is used, all KPI's are editing with the Formulate toolset. Here users can use the point-and-click graphical formula editors or write logic using PQL or MDX script.
KPI's as Conditional Formatting
KPI's are, in effect, an advanced form of conditional formatting - adding and adjusting both an icon and color based on values to highlight information in the visual beyond its own visible values. As such, basic KPIs can also be built using conditional formatting and drop zones in Discover without the Quick KPI wizard or the formal KPI toolset.
Types of Quick KPIs
The heuristic engine in Pyramid changes the types of quick KPIs available based on what is used and selected to trigger the KPI tool. The selections can be made from both the measure element trees or directly from visuals. The source will determine the type of heuristic presented.
Query Context KPIs
These KPI's are triggered from the visualization (typically a grid) and are generated in the context of the current query's hierarchical selections. The logic and choices are influenced by which measures are shown, the number of hierarchies shown and if there are any date-time hierarchies in the query.
Basic KPIs
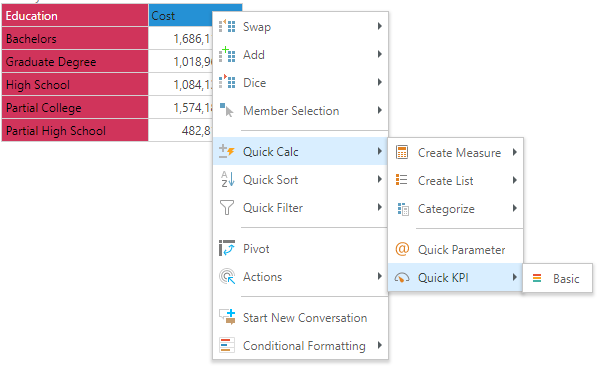
These are a basic KPI created by simply comparing every data point in the query for the given cohort against every other one - and then doing a simple 3-band ranking. Given their simplicity, the basic KPI is more-or-less an accelerator for building a more complex layer of logic - since most users will edit the basic setup to add more logic. The mathematics of Basic KPI's can be matched using simple conditional formatting, however, it will ignore the cohorting of the existing hierarchies - which can be useful once the query changes. For example, this builds a basic KPI for cost using the education hierarchy as the cohort (evaluation set).
Period-on-Period KPIs
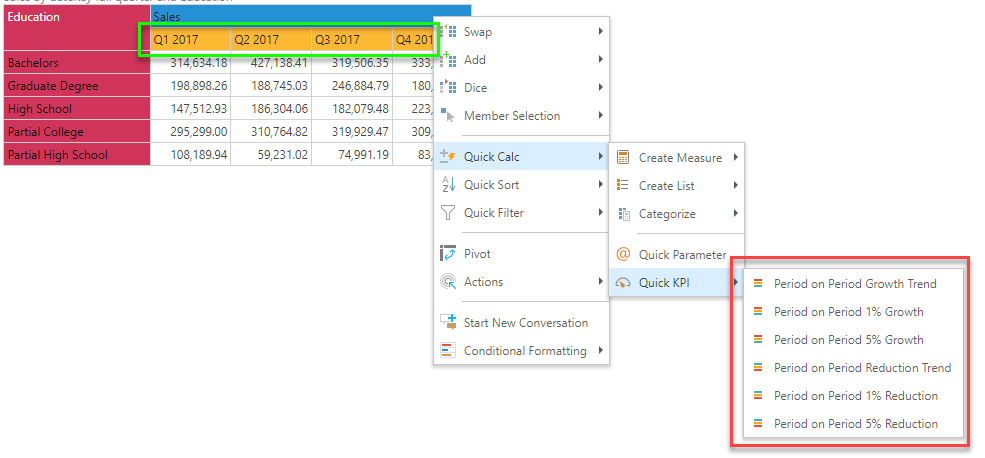
These are KPIs created using time difference logic as well as cohorts - and then doing a simple 3-band ranking. The Period-on-Period KPIs only appear in the list if a date-time hierarchy is detected in the current query. Unlike the basic KPIs, the period on period math injected into the KPI formulation provides a layer of logic that is not easily matched with conditional formatting without building some formulas. This, with the auto-cohorting, offers a quick way to calculate whether figures for the given hierarchy are improving or degrading from one period to the next (as required), an banding the results compared to others in the cohort (evaluation set). For example, this builds a KPI for measuring which education groups are improving from one quarter t the next, compared to other education groups in any given quarter.
Measure Tree KPIs
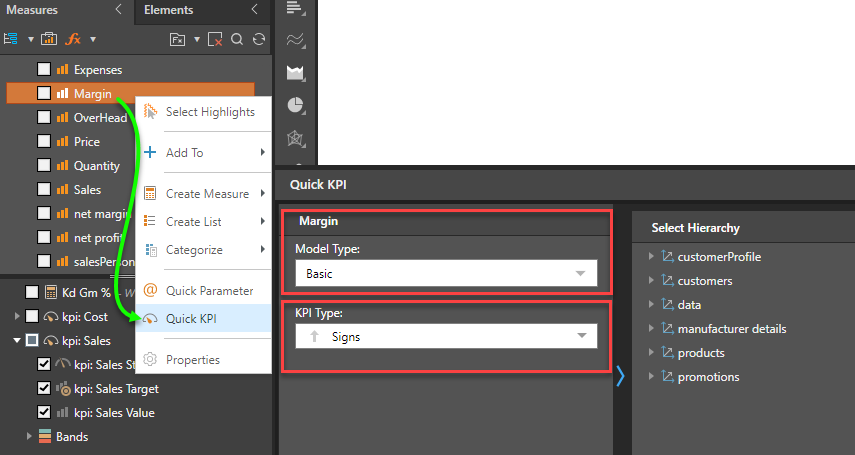
These KPI's are triggered from the measure element tree and are accompanied by a pop-up dialog letting the user dictate the cohort hierarchy (evaluation set) and date-time hierarchy (if a period-on-period KPI is chosen). Once created, the KPI is simply added to the custom measure listing at the bottom of the measure tree - and has to be deployed manually into the query. Importantly, this approach also lets the user pick the KPI graphic as well.
Building Quick KPIs
To build quick KPIs start by making selections of the relevant measure trees or visuals. Then right click, and choose the relevant KPI logic from the context menus. See examples and the below for more.
Managing Quick KPIs
KPIs created from the quick menus can be fully edited, deleted and shared like any other KPI item in the system. Click here to read more on how to manage quick KPIs and other calculations.
Examples
The following examples demonstrate the basic and period-on-period Quick KPIs.
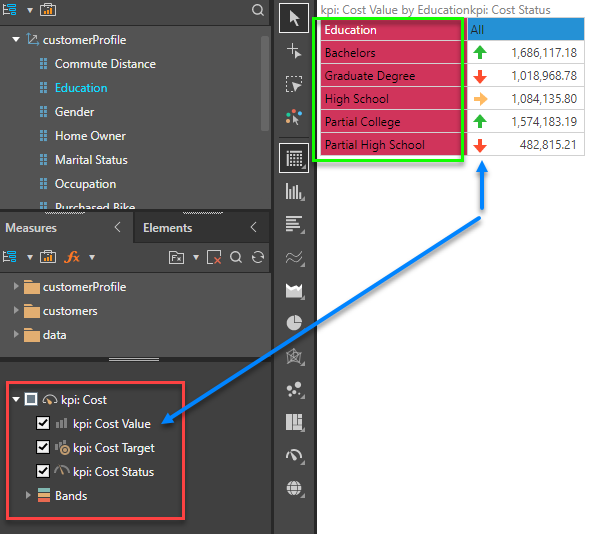
In this example, the user simply right-clicks on the cost measure, choosing Basic from the context menu.
The resulting KPI simply compares each education item to the other across the cost metric, broken out into 3 bands.
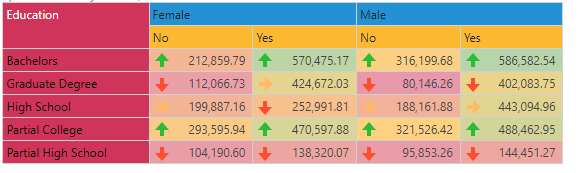
Even if the query is changed (here it's broken out by gender and marital status), the KPI keeps operating as expected. Contrasting that with conditional formatting (driving the cell background color), we see a divergence in some cells (where the colors do not match).
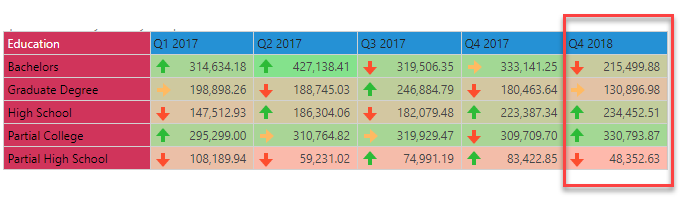
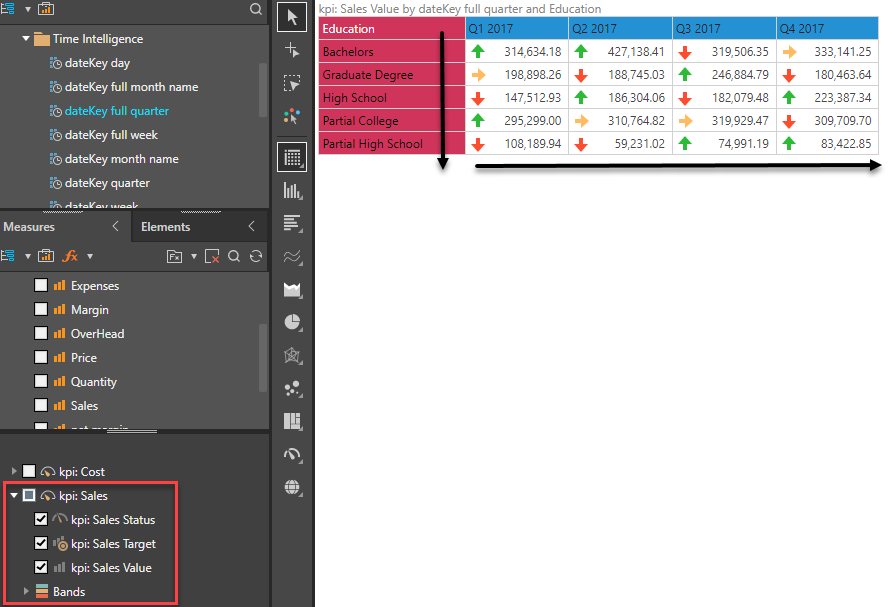
In this example, the user simply right-clicks on the sales measure, choosing period-on-period 1% growth from the context menu. These options are available, because the engine recognizes a date-time hierarchy in the query (quarters), and will be KPI's using both this time hierarchy and the eduction hierarchy as the cohort (evaluation set).
The resulting KPI compares each education item from one quarter to the next, showing a result of whether there is growth of more than 1%. The color of the indicators is driven by how well any education item did compared to the other items in a given quarter - which is broken out into 3 bands. As such, this dynamic KPI, calculates both down the education items and ACROSS the quarters.
Importantly, the metrics for Q1-2017 are measured using Q4-2016, even though it's not the query.
Contrasting the results with conditional formatting (driving the cell background color), we see a divergence in many cells (where the colors do not match). And if we added in Q4-2018, the KPI logic works for all data points, while the conditional formatting is influenced by the inclusion of the new quarter of data into the query. The resulting status is quite different.